Using the Khoros Bulk Data API
The Community Khoros Bulk Data API provides a daily extract of event logs for a specified community, available in either JSON format or as a flat CSV file. (Refer to the attached example export at the end of this article for details.) Khoros event logs capture client-side request information along with all related details tied to the requests. In the Community Analytics, events are aggregated into metrics such as Page Views, Posts, or Likes counts. Importantly, the Bulk Data API excludes traffic from bots and crawlers, ensuring that event data closely resembles what is reported in Community Analytics. You can utilise this API to store community event logs for specific days in your own database. This enables you to use your preferred reporting tools to create custom metrics, key performance indicators (KPIs), and reports, which you can schedule and run automatically on a regular basis. For more information about using the API and details regarding the captured events, please refer to the Developer Documentation Portal. 856ViewsSign in to react to this post
 0Comments
Best Practices: Community Experience Surveys in Aurora
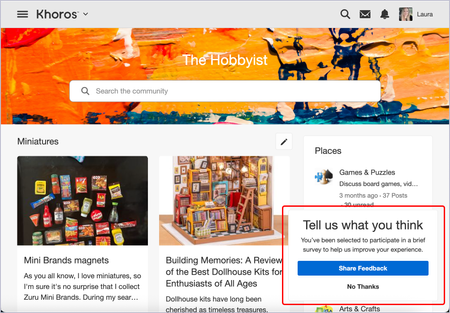
Community Experience Surveys provide community managers with a way to identify issues and optimize the community. Does this replace my existing survey tool? No. The Community Experience Survey complements any existing survey tool you may have. However, the Community Experience Survey provides more granular member details, such as node- and rank-specific data, that other tools can’t provide out of the box. Where should I deploy the survey? Where you deploy the survey depends on what questions you want to answer. For example, if there are certain boards you want to focus on, then deploy the survey there. However, you can also deploy surveys in the entire community first to get a sense of the baseline response and response in each place since you can always filter at the board level in the CSV Export for survey responses. When should the survey fire? We recommend not firing the survey immediately when a visitor lands on the page as it is disruptive to the user experience. (Remember, your visitors are there for a specific reason, and you don’t want to get in the way of that goal.) However, at the same time, you don’t want to wait too long to fire the survey as the browser session may expire. We recommend something in between. One approach is to see what your average Member Time on site is from Community Analytics and reduce that value by 20% to get close to the time when a user is nearly complete with their task/session. How long should I run the survey for? How do I know I’ve collected enough data? We recommend running the survey continuously so that you have a larger set of data to analyze. Visitors will receive the survey once within a 90-day period (by default, but this setting is configurable). However, if you plan to turn the survey off at some point, we recommend keeping the survey running for as long as it takes for the mean/average of the results to stabilize and not change much with additional samples. What’s a good response rate? For web-based surveys, 5-15% is a good response rate. For mobile-based surveys, 10-20% is a good response rate. Since the majority of community traffic is still web based, you should hope to see about a 10% response rate.373ViewsSign in to react to this post0CommentsAurora: View community experience survey results
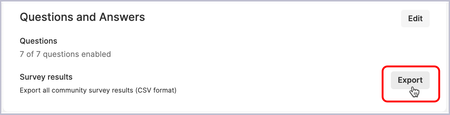
Admins can enable community experience surveys, which prompt members to provide feedback about their experience in the community (see Create community experience surveys). Survey responses and scores can be collected via an export. These results are in CSV format. To export community experience survey results: Open the Account menu. Select Settings. Select Content Features. In the left column, select Community Experience Survey. In the Questions and Answers section, beside Survey results, select Export. The CSV file contains the following information for each visitor who responded to the survey: The date on which the survey was taken The place in the community where the survey was triggered The username of the member who took the survey The member’s rank The member’s role(s) The answers given to each question425ViewsSign in to react to this post0CommentsAurora: Create community experience surveys
Admins can enable community experience surveys surveys, which prompt members to provide feedback about their experience in the community. Survey responses and scores can be collected via an export (see View community experience survey results). Create a survey Creating a survey requires several configuration steps, including designing the branding, designing its behavior, selecting its questions, and finally, turning it on for visitors. To access survey configuration options: Open the Account menu. Select Settings. Select Content Features. In the left column, select Community Experience Survey. Set up your survey: Design survey branding Design survey behaviors Select your questions Turn on the survey for visitors Design survey branding In the Branding area, select Edit. In the window, update the following as needed: Community name: The community name used in survey questions Brand name: The brand name used in survey questions Survey logo: Use a PNG or SVG logo; horizontal preferred. Text color Header background color: Used in the background of the survey header Select Submit. Design survey behaviors In the Survey Behaviors section, select Edit. Select whether you want to Present To: Signed-in members Anonymous users Both members and anonymous users (Optional) Select the role(s) you want to survey. (Optional) Select the role(s) you don’t want to survey. (Optional) Select the place(s) where you want the survey to be triggered. In the Frequency area, enter the number of Maximum responses to collect per month. This field sets the maximum number of surveys to collect for a given calendar month. After collecting this number of responses, no users will be prompted to take the survey until the first day of the following month. Enter a number of visits in the Present survey after this many visits field. This field sets the number of visits (0-500) to wait before prompting a viewer to take the survey. For example, if set to 3, the viewer isn’t prompted to take the survey until their fourth visit. Default = 0, which is the first visit. Enter a number of minutes in the Present the survey after this many minutes field. This field sets the number of minutes (1-60) to wait before prompting a viewer to take the survey after the defined number of visits have occurred. Default = 2. In the Conditions area, enter a number of days in the If declined/abandoned, repeat after this many days field. This field sets the number of days (1-365) to wait before prompting a viewer to take the survey after they’ve declined to take the survey. Default = 30. Enter a number of days in the If completed, repeat after this many days field. This field sets the number of days (1-365) to wait before prompting a viewer to take the survey again after they have already completed it. Default = 90. Select Save. Select your questions In the Questions and Answers section, select Edit. Use the toggles to turn on or off the questions you want to include or exclude on your survey, respectively. Some questions have follow-up questions based on the selected responses. Note: Because this survey is intended to gather important metrics and feedback, including CSAT (Customer Satisfaction Score), updating question titles and the order of questions is not permitted. Use the checkboxes by responses under your selected questions to designate which responses will be available for those taking the survey. Select Save. Turn on the survey for visitors After you have designed your survey the way you want it, you can enable it for your visitors by turning on the Community Experience Survey toggle at the top of the Community Experience Survey section.1.3KViewsSign in to react to this post3CommentsAdd third-party analytics to your community
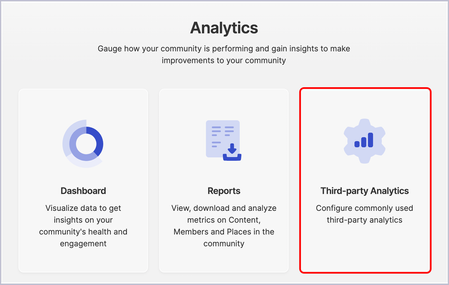
Community administrators may require tracking scripts from third-party analytics in their communities. With the Third-party Analytics tool in Communities Analytics, administrators do not need to understand GraphQL or Handlebars in order to integrate with analytics tools and start analyzing their community on those platforms. Instead, they can add their third-party provider using an ID. Refer to your provider’s documentation to locate the ID and to learn how to analyze the data pulled from your community. Note: At this time, Google Tag Manager, Google Analytics, and Meta Pixel are supported in our Third-party Analytics tool. You can add other analytics providers via Page Scripts in Developer Tools. Analytics providers added through Developer Tools are displayed on the Third-party Analytics page but are not editable from that location. To add third-party analytics providers: Open the Account menu and select Analytics. Select Third-party analytics. At the top-right of the page, select Add Provider. In the Add Provider window, select the appropriate Analytics provider. Enter the Tag Manager ID, Google Analytics ID, or Meta Pixel ID as appropriate. Select Add. The provider you added is now shown on the table. In the Active column, toggle on or off the provider as desired. Note: Open the Options (three dots) menu to Edit or Delete the provider as desired.554ViewsSign in to react to this post0CommentsAurora: Getting started as a Community Analyst
Welcome to Aurora! This introduction guides you through the most commonly used features specific to various tasks you can perform as a community analyst, linking each of them to articles on how you can use the Aurora Analytics to achieve these tasks. Measuring the data, tracking your success, and using it to prove how your community is advancing the organization’s broader initiatives will give your community a strong strategic footing. Your primary task as a Community Analyst is to prove your online community’s engagement and value with strong data. Before you begin You need to work with the Community Managers to have a thorough understanding of your community requirements: What are your organization’s goals? What are your team’s goals? What are your community’s goals? Once you have answered these questions, you come up with the Key Performance Indicators (KPIs) to measure against these goals. KPIs represent how your community is performing against strategic goals. So, the KPIs must be relevant to the business and community goals. Choose only those few KPIs that will help move your business forward. For example, the KPIs to increase revenue or increase retention or increase loyalty, and so on. You track and measure these KPIs with benchmarks for each at launch, six months later, nine months after, one year, and so on. Tracking KPIs in this fashion helps you make changes, as necessary, to meet your company’s vision. While KPIs represent how you’re performing against strategic goals, metrics are your “business as usual” measures that still add value to your organization but aren’t the critical measure you need to achieve. Every KPI is a metric, but not every metric is a KPI. Example: Let's say Increase in Customer Engagement is one of the identified KPIs. To measure this, you need various metrics, like Monthly Active Users (MUA) that tracks the number of unique users who visit your community over some period of time and Daily Active Users (DAU) that tracks the total number of people who open and engage with your community in a given day. The DAU to MAU ratio is a useful metric to measure the stickiness of your community. Also, if you see that MUA has dropped since last month, you have something to investigate. Whatever is your goal in hand for business or for the organization, you’ll need to figure out a way in advance how you plan to calculate where you are standing now and how you will achieve the goal. Khoros Community Analytics helps you measure and improve the performance of your community by gaining insights into your community's health. Through a unique combination of performance metrics and web analytics, we offer the deepest insights into customer engagement across your community. Khoros Community Analytics The Khoros Community Analytics dashboard collects data and displays metrics for your community. Note: You must have the Access Reports in Community Analytics permission to access the Khoros Community Analytics dashboard. Getting Started Getting around Khoros Community Analytics to familiarize yourself with each section on the dashboard Enable and access Community Analytics on how to use the dashboard Accessing, downloading and scheduling different reports to understDownloadand the different community metrics you can view Community Analytics metric definitions Viewing data for specific dates Apply filters to Community Analytics reports Schedule Community Analytics reports to be emailed to you Manage scheduled reports Download or schedule member-related reports Engagement drilldown data for different content types Ideas specific reports Khoros Academy Khoros Communities Analytics Essentials course779ViewsSign in to react to this post0CommentsCommunity Classic 24.05
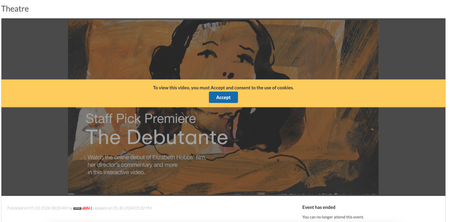
Member Experience Consent for third-party cookies usage in Events Removed limits on number of recipients for Private messages Member Experience Consent for third-party cookies usage in Events In Communities v23.10, we introduced an enhancement requiring users to explicitly consent for using cookies while uploading or viewing external videos in the posts. In this release, we have extended this enhancement to the Events. Now, members must explicitly consent to the usage of cookies when they use external videos to host Events on the Community. Below is an example of the consent banner on an events page: Removed limits on number of recipients for Private messages For communities in version 20.6 and later, messaging was limited to 10,000 users per message by default, with the option to configure this limit. With this release, we have removed these limitations altogether. You can now send messages to an unlimited number of users without any restrictions.1.9KViewsSign in to react to this post8CommentsAurora Analytics: Idea Status Set trend
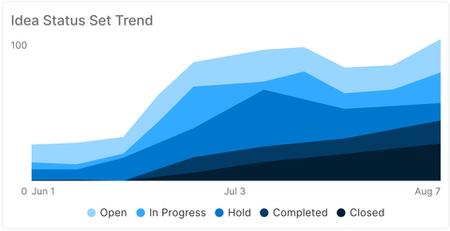
The Idea Status Set trend widget on the Ideas Dashboard (Options menu > Analytics > Dashboard > Ideas Details) displays the change in Status Sets and Statuses of ideas. Idea Status Set/Idea Statuses: When the dashboard is scoped to the community or to a Group, the widget shows the trend along with the breakdown of ideas based on Idea Status Set. When the dashboard is scoped to a specific Idea board, the widget shows the trend along with the breakdown of ideas based on the Statuses defined for that board.186ViewsSign in to react to this post0CommentsAurora Analytics: Ideas by Age
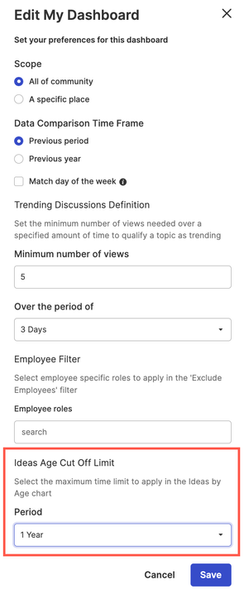
You can specify a maximum time limit in the dashboard settings for the Ideas by Age chart. This setting determines the range of time considered for grouping ideas. The data shown in the Ideas by Age chart adjusts based on the maximum time limit set in the dashboard. In the above bar chart, 8 ideas had their last status update 3 months ago. The default maximum time limit is set to 6 months. For the above bar chart, this is set to 12 months. All the ideas that had their last status update or were created 12 months ago or earlier are grouped together. The Ideas by Age widget displays the ideas in the community grouped by the time since their creation. To view this widget, go to Options menu > Analytics > Dashboard > Ideas Details The Idea Details dashboard page opens and you can see the Ideas by Age chart listed. The chart displays the ideas in the community grouped by the time since their creation and by the time since their last status update.67ViewsSign in to react to this post0CommentsAurora Analytics: Breakup of Ideas in different Status Sets and Statuses
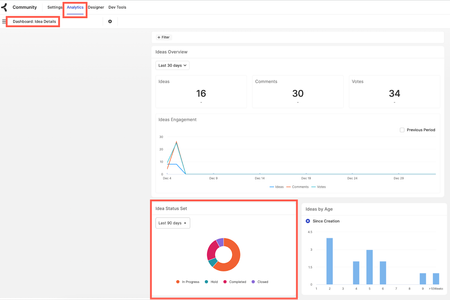
The Idea Status Set and the Idea Statuses widget display the breakup of ideas in different Status Sets and Statuses, respectively. To view this widget, go to Options menu > Analytics > Dashboard > Ideas Details. When the dashboard is scoped to the community, the Idea Status Set widget shows the breakup of ideas by Idea Status Set. When the dashboard is scoped to a specific Idea board, the Idea Statuses widget shows the breakup of ideas by Statuses defined for that board.150ViewsSign in to react to this post0Comments